
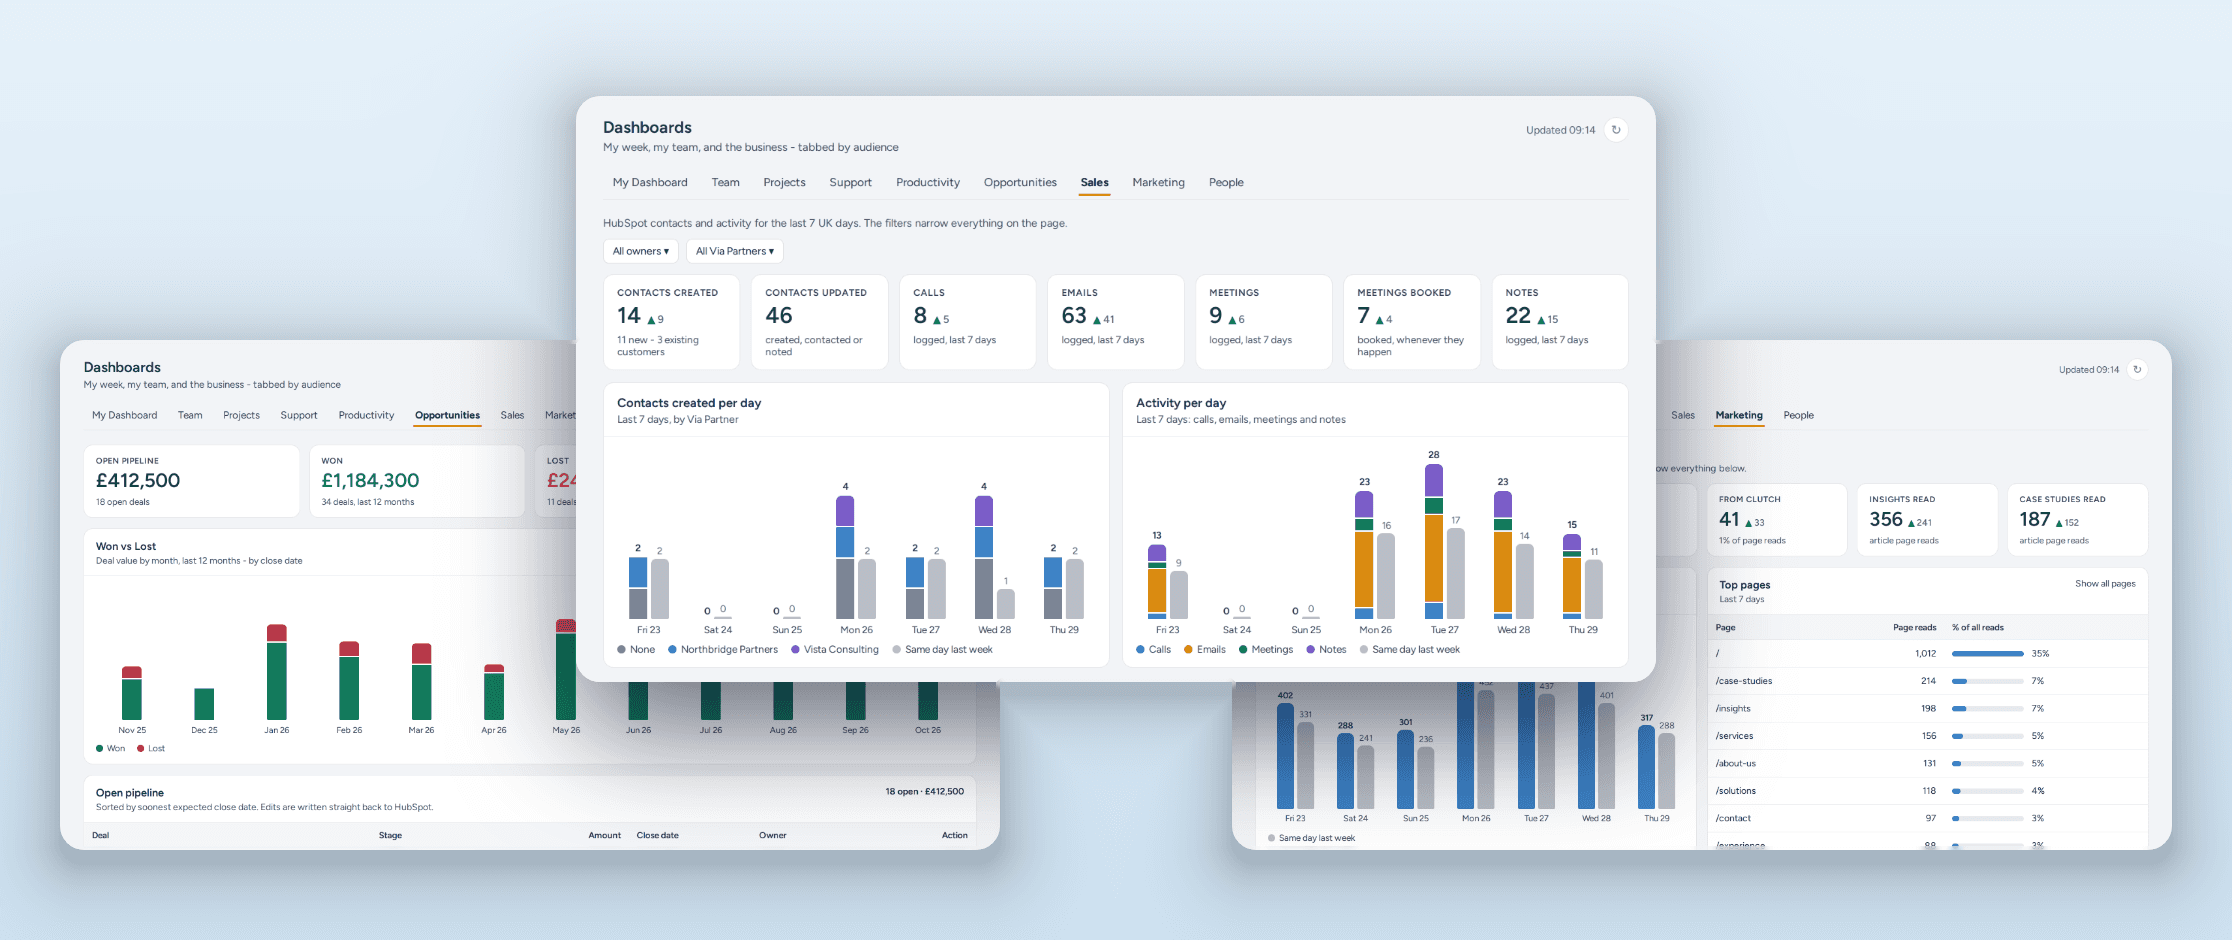
How we brought HubSpot, LinkedIn, Apollo, Google Analytics and our demo experience into a single, always-live set of dashboards in our bespoke Insyte App, with real-time write-back to the source.
At a glance
- Sources: HubSpot (sales activity and deals), LinkedIn company page and LinkedIn Ads, Apollo email sequences, Google Analytics, and our Insyte Experience demo portal
- Where it lives: Sales, Opportunities and Marketing dashboards inside our bespoke Insyte App, the business app we run InsyteGroup on
- What's in them: top-level numbers and trends together with all the operational detail behind them
- How it works: live from the source APIs, cached for instant load, refreshed every 15 minutes in the background
- What makes it different: real-time write-back to HubSpot, live click-through to activity notes, role-based access, and InsyteAgent working over the same data
- How it's used: daily campaign checks, the weekly operational meeting and the weekly sales pipeline review
The challenge
We're often our own first client, and it's great to have first-hand experience of using what we build ourselves, in practice. Our own commercial picture was a good test, because like most growing businesses it was spread across too many tools. Sales activity and deals sat in HubSpot. Company page performance and boosted posts were in LinkedIn, in two different places. Outreach ran through Apollo sequences. Website traffic sat in Google Analytics, and interest in our demo experience lived in the portal's own database.
Every one of those tools has a perfectly good interface. The problem was the gaps between them. Answering a simple question such as "is this campaign working?" meant flipping between web apps, lining up date ranges and trying to correlate performance by eye. Did the LinkedIn post drive website visits? Did the Apollo sequence lead to replies, demo requests or new contacts in HubSpot? By the time you'd pieced it together, the moment to act had often passed.
We wanted what we build for our clients: a single view, always live, that the whole team could trust.
What we built
We added three dashboards to our bespoke Insyte App, each answering one question.
Sales: who got in touch, what did we do about it, and what's coming up? New and updated contacts, split between new prospects and existing customers. Calls, emails, meetings and notes logged in HubSpot. Meetings booked, upcoming meetings, and the companies we've flagged as In Focus. Filters for owner and introducing partner narrow every card and chart at once, so we can also see which leads our partners bring in.
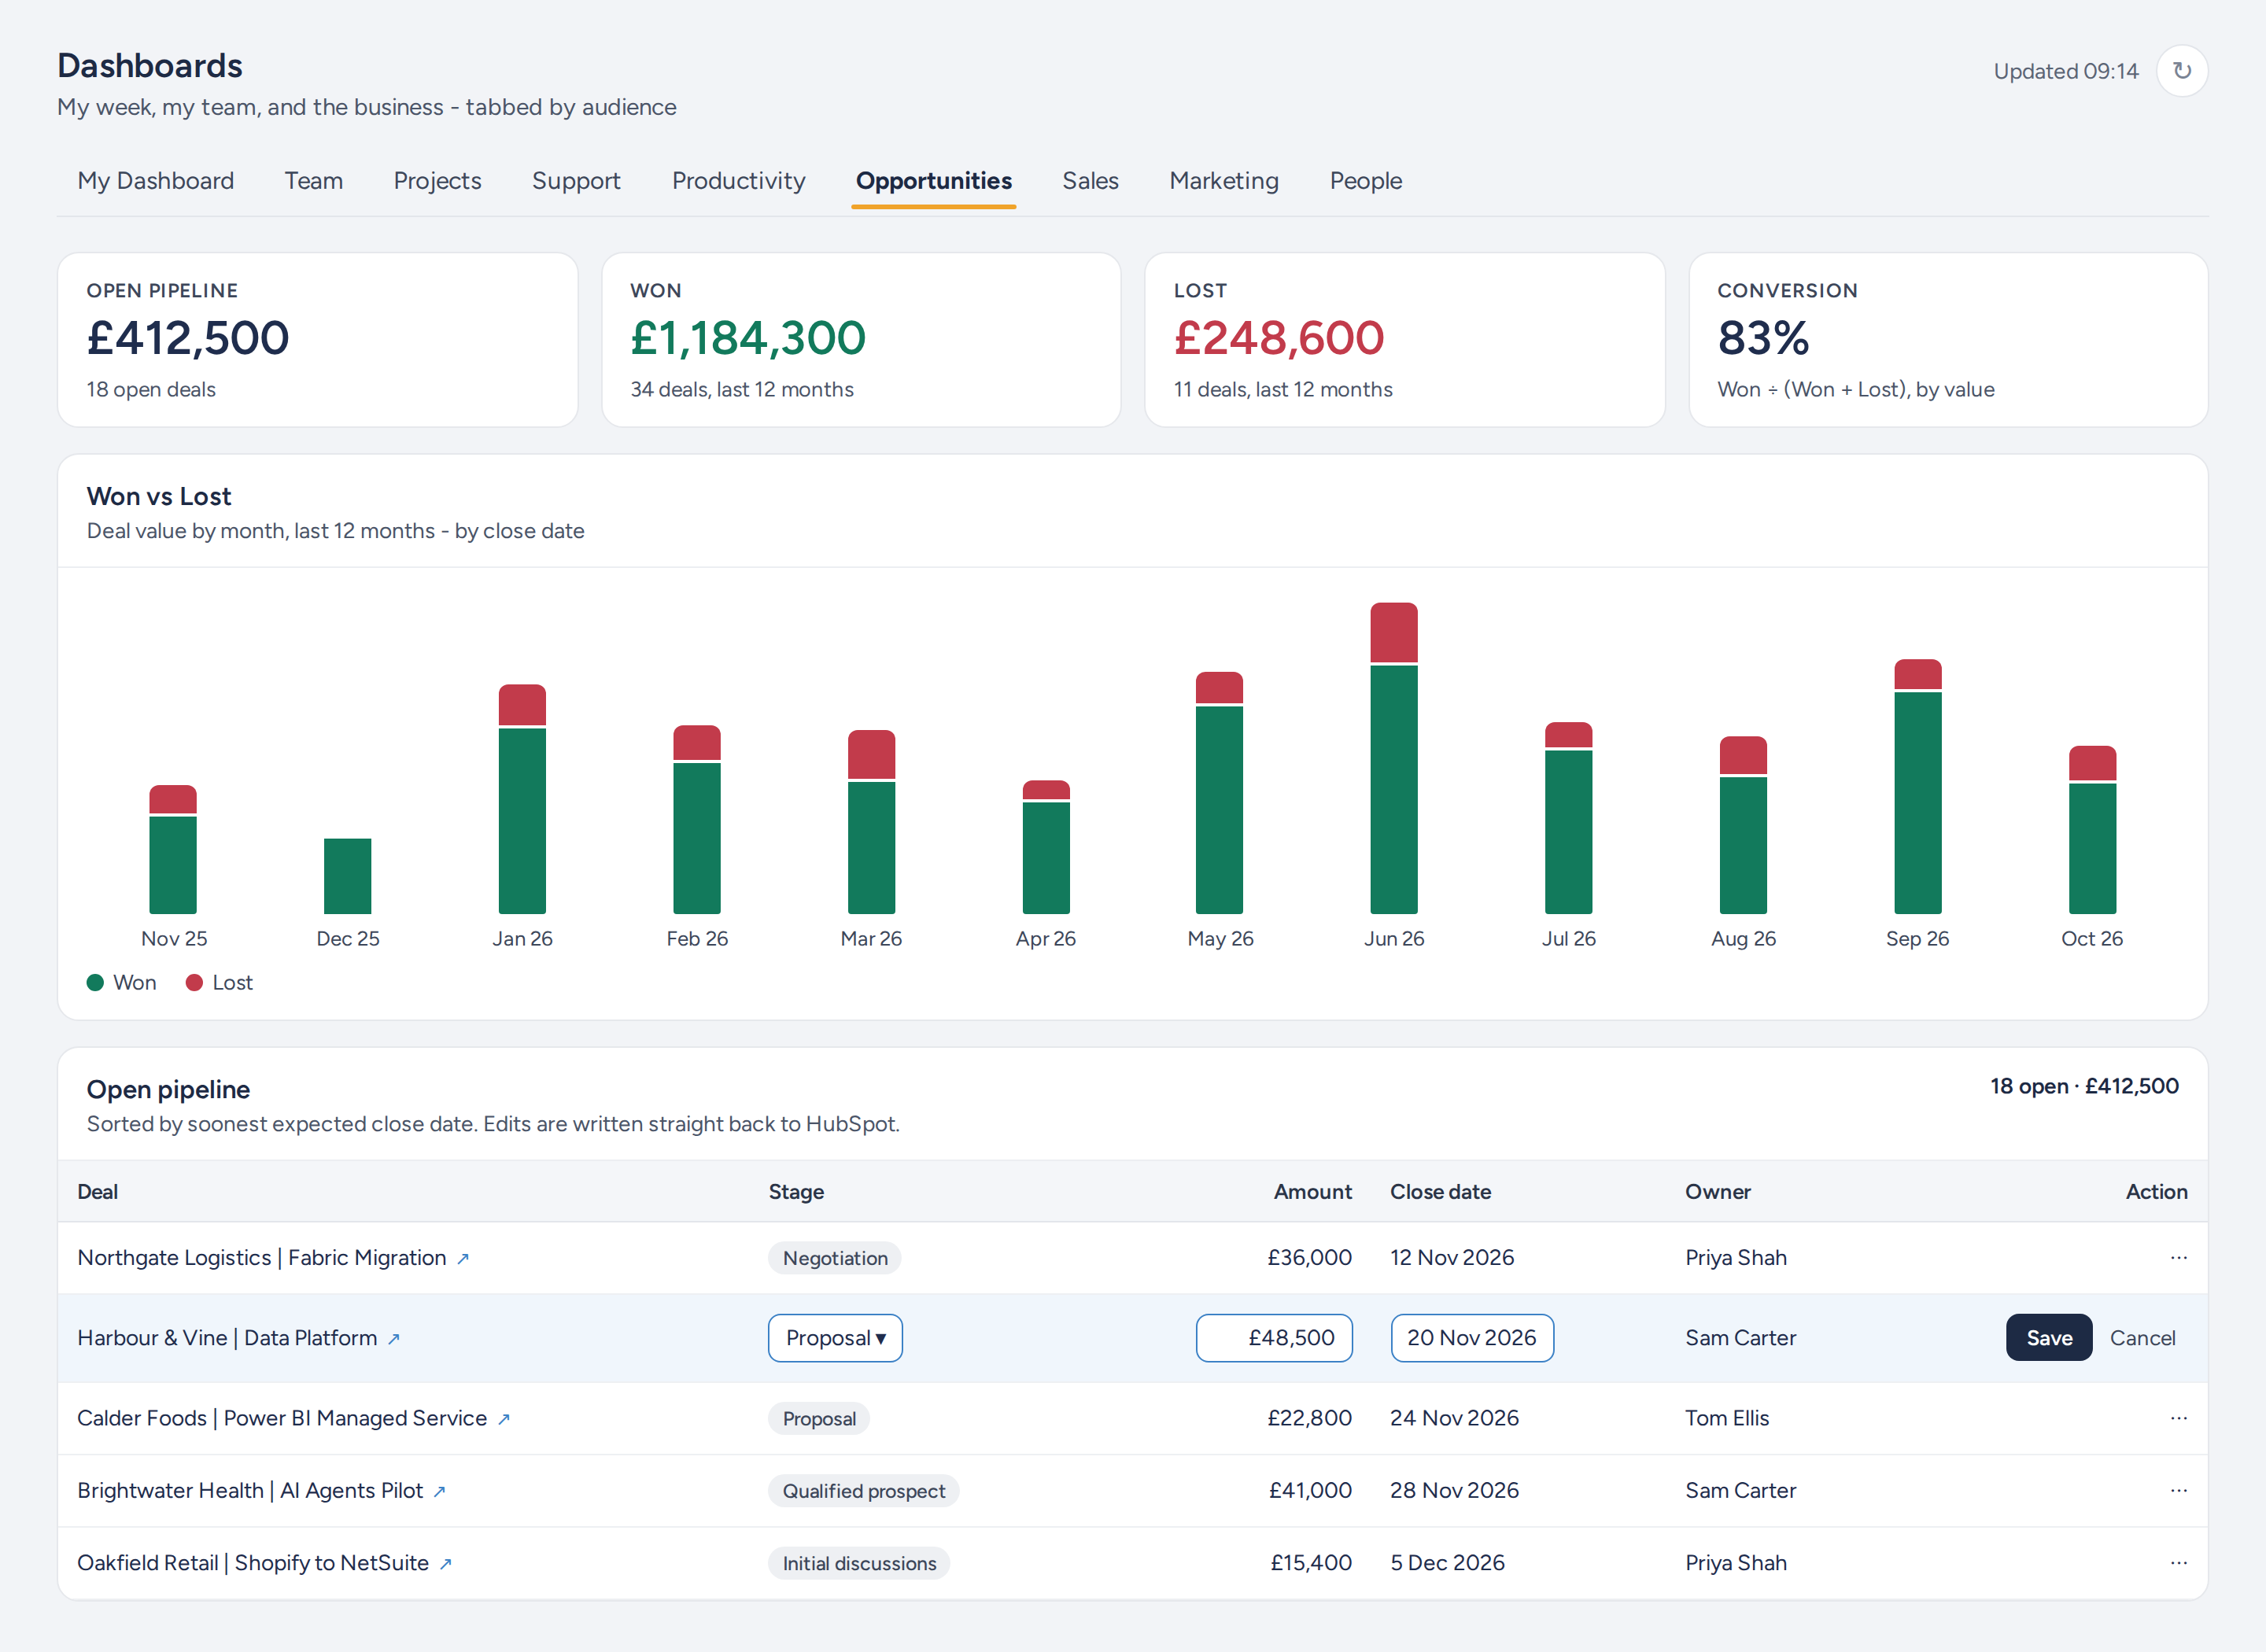
Opportunities: what is the pipeline worth, and what did we win or lose? Open pipeline, won and lost value over the last 12 months, conversion rate, recently closed deals and new opportunities. Every open deal is listed by expected close date, with overdue deals flagged.
Marketing: what is bringing people in, and is it working? One page, four sections:
- Google Analytics: page reads, where readers came from (Google, LinkedIn, Clutch and more), when they read, and which insights and case studies are performing. Click a referrer or a day and the whole section narrows to it.
- Email sequences: delivery, reply, bounce and unsubscribe rates for each Apollo sequence and each step, with the clicks each one produced.
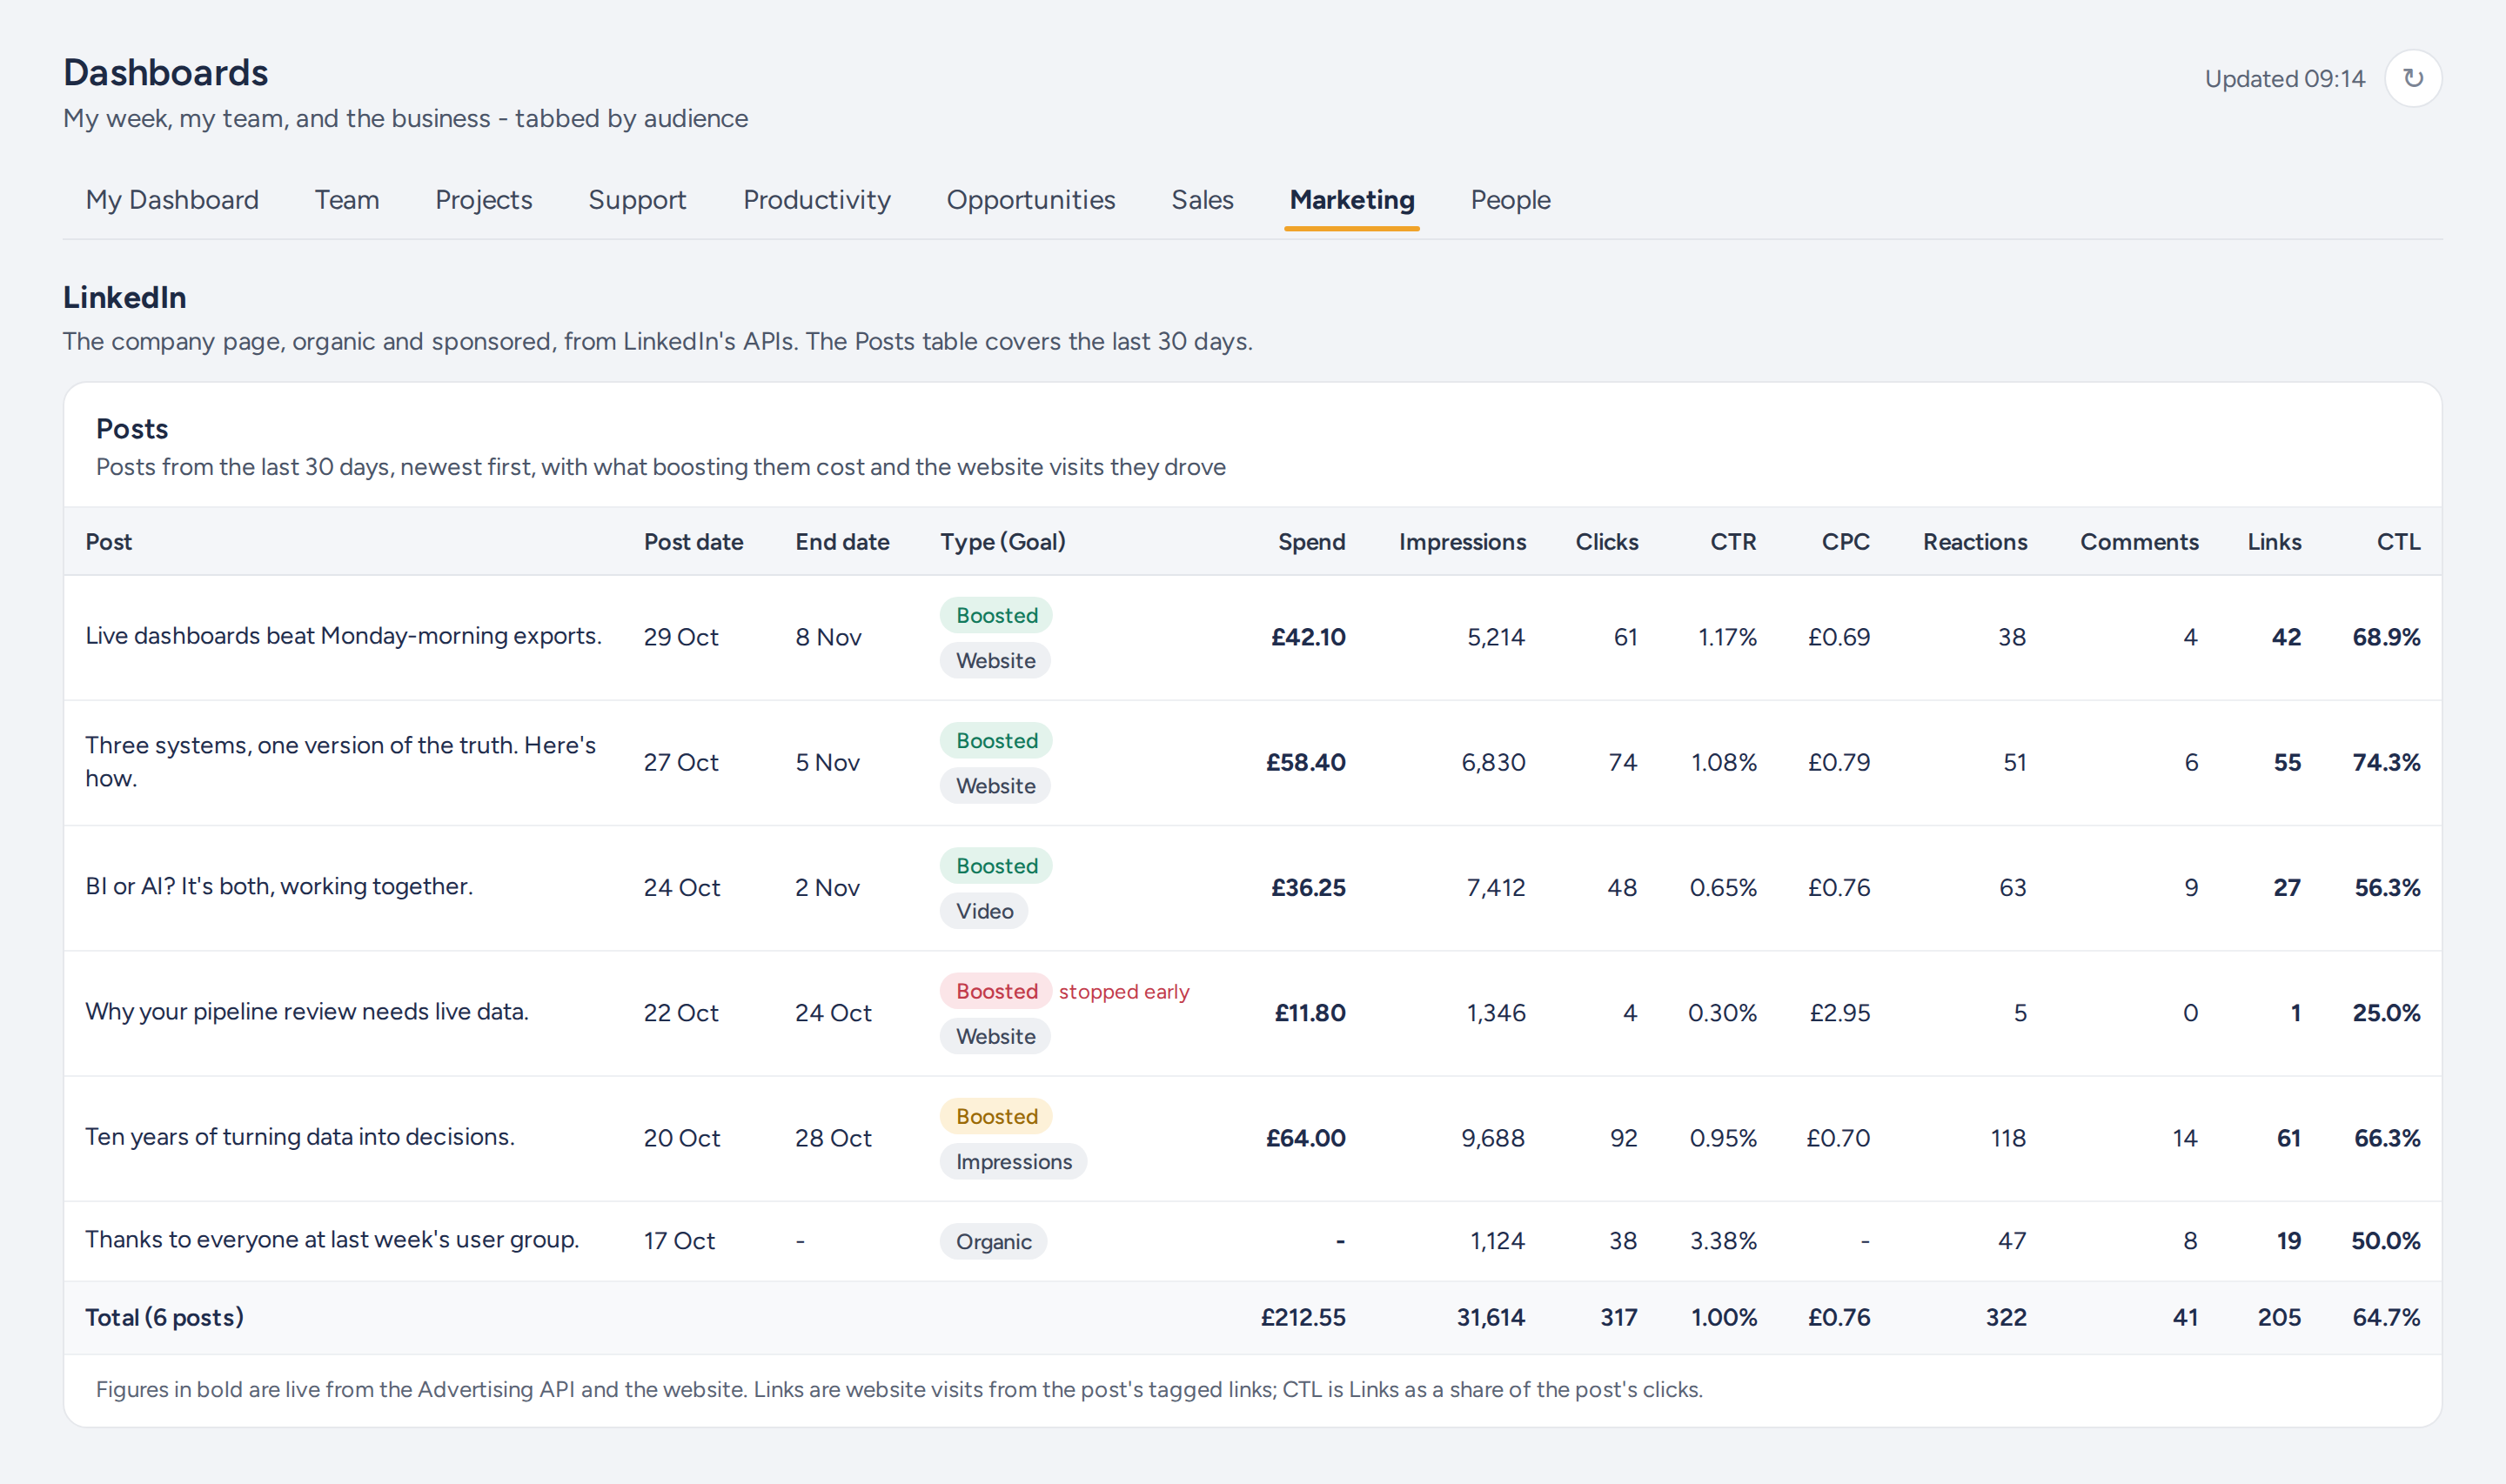
- LinkedIn: impressions, clicks, engagement, visitors and followers, split between organic and sponsored, plus ad spend and cost per click. A posts table shows every post from the last 30 days with its spend and results, and each boost's goal.
- Experience: who has requested access to our demo portal, which partner they came through, whether they accepted, and how much they've used it since: pages viewed, dashboards opened, questions asked.
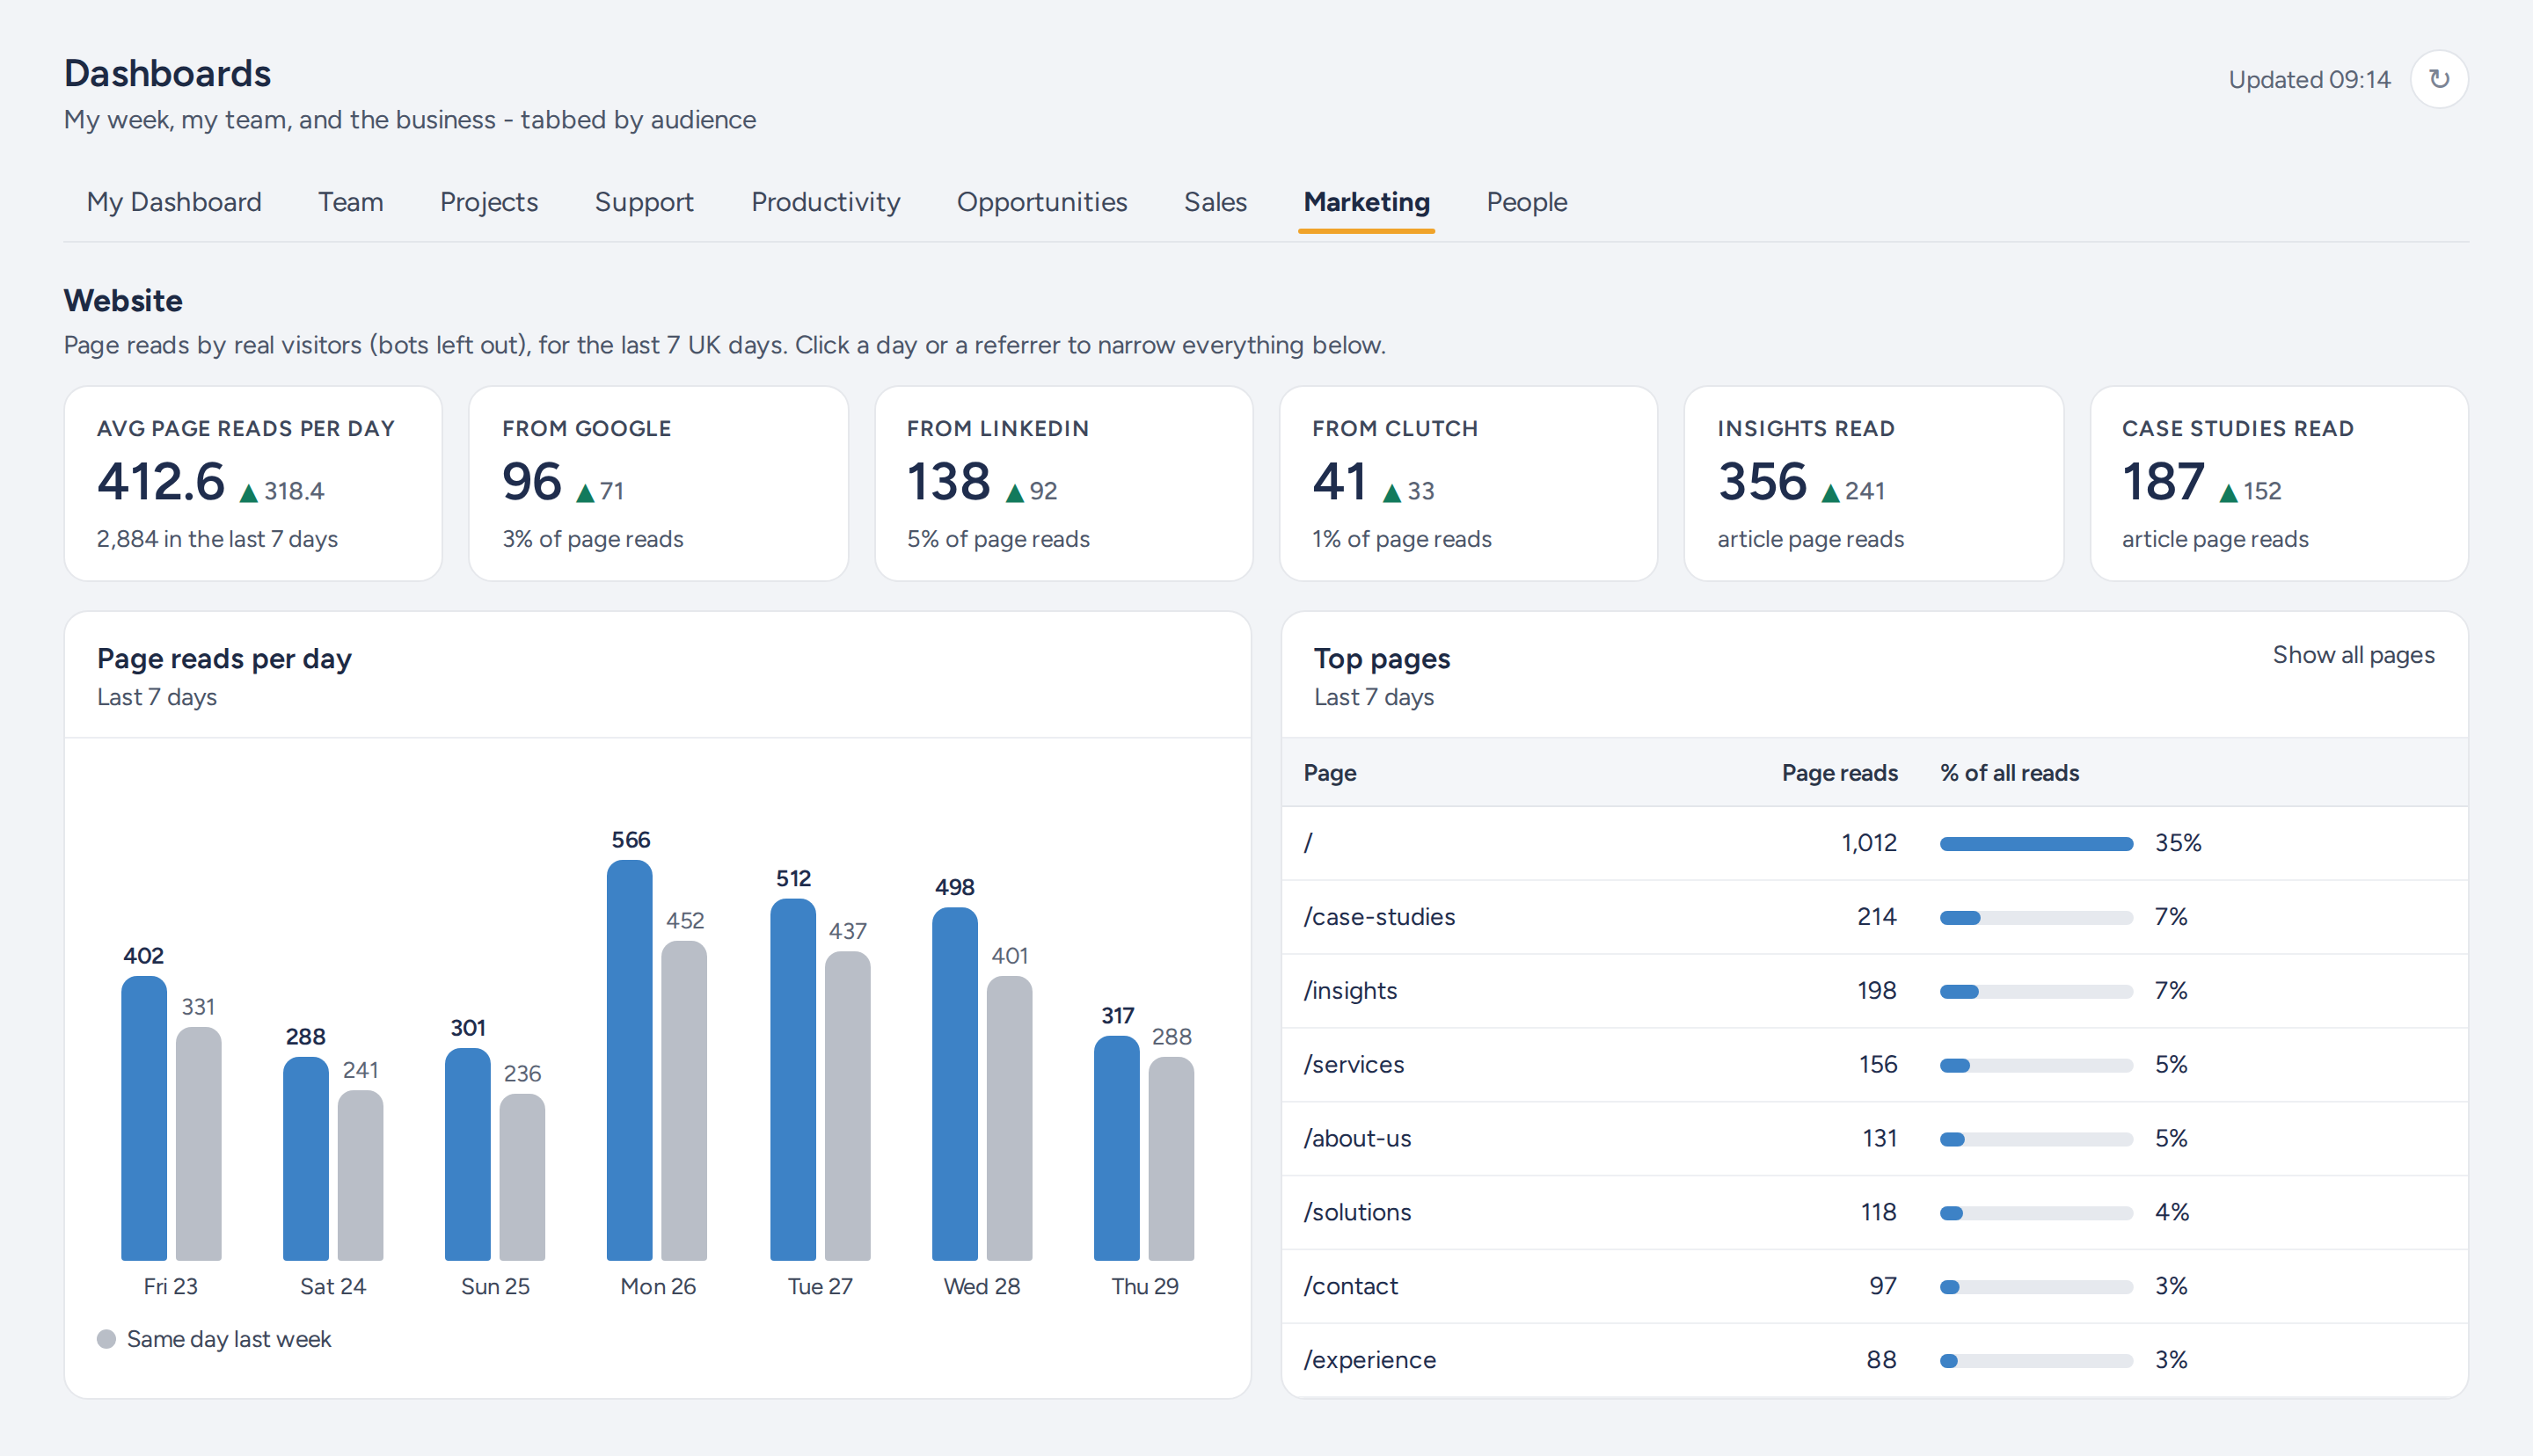
Tying campaigns to the website. Every link we share in an Apollo email, a LinkedIn post or even our email signatures carries campaign tags naming the campaign, the sequence step or the post. Google Analytics records them when someone lands on the site, so each email step and each post is credited with the visits it actually drove. That sits beside the post's spend and clicks, and the sequence's replies, on the same page. For every LinkedIn post we can see how many of its clicks became actual visits to our website, not just clicks on LinkedIn. Our own clicks on our links are excluded, so the numbers are real visitors.
More than a typical dashboard. Alongside the top-level numbers and trends sits all the operational detail behind them: every contact, meeting, deal, post, sequence step and demo request. The headline and the work that drives it are on the same page, so you can go from "replies are down this week" to the sequence, the step and the contacts concerned without leaving it. Putting every detail on the page may not be practical for a large business, but for an SME like us it's ideal. Every card compares the last seven days with the seven before, so the question is never just "what happened?" but "is it better or worse than last week?"
Sales and marketing aren't on their own. The Insyte App's dashboards are tabbed by audience: My Dashboard for each person's week, Team, and then the business, with project performance, support, team productivity, people management and finance alongside opportunities, sales and marketing. Every area of the business is in the same app. They're built the same way, for the reasons we set out below.
How we use it
Every day, to manage campaigns. We check the impact of LinkedIn posts and Apollo sequences daily. Each boost is judged against what it was set up to do, whether that's website visits, video views or impressions, with its spend and results side by side. So we can stop underperforming boosts early, rather than finding out at the end of the campaign. The posts table shows it plainly: a boost we stopped after two days is marked as stopped early, with its end date moved to the last day it spent.
Every week, to run the business. The dashboards are the working view in our weekly operational meeting and our weekly sales pipeline review. Nobody prepares slides or exports; we open the app and the numbers are current.
No more flipping between web apps to work out what's driving what.
Live, without the wait
Reading straight from half a dozen APIs every time someone opens a page would be slow. So the dashboards cache their data in a database. A page opens instantly from the latest copy, then fetches fresh data from the APIs in the background and updates in front of you when it's done: no reloads, no browser refresh. A background refresh also runs every 15 minutes, so the data is usually already current before anyone looks.
The result feels like a live app, not a report you wait for.
From viewing to doing
Two things take the dashboards beyond reporting.
Write-back to HubSpot. Any open deal can be edited in place, from the Opportunities dashboard or the full Opportunities page with its Open, Won, Lost and On Hold views. Stage, value and expected close date are written straight back to HubSpot, and moving a deal to a closed stage sets its close date. The change shows on the dashboard at once. The weekly pipeline review updates the CRM as it goes, rather than producing a list of changes for someone to make afterwards.
Live click-through. On the Sales dashboard, click a call, email, meeting or note and the detail is pulled from HubSpot in real time: who logged it, when, and what was written. Leadership can go from a headline figure to the conversation behind it in one click.
Who sees what
Access is set by role. The whole team sees the marketing dashboard and the highlights of sales, so everyone knows what's working and where the pipeline stands. The leadership team sees the detail of every sales activity and meeting, including the notes behind them.
Why a custom BI app, not Power BI
We build Power BI for clients every week, and it remains the right answer for most reporting. For this, it wasn't, for three reasons.
We wanted it live to the APIs. HubSpot, LinkedIn and Apollo are REST APIs, not databases. Power BI would mean landing that data on a schedule and reporting on the copy. We wanted the dashboard itself talking to the sources, refreshing in the background while you watch, and pulling activity notes from HubSpot the moment you click.
That matters most in meetings. Sometimes people update their deals and log their notes just before the pipeline review. It's human nature, and a scheduled refresh would put the previous version in front of us. To review and make decisions on the latest information, it has to be live.
We wanted write-back. Updating a deal's stage, value or close date from the dashboard was a requirement from the start. Write-back is possible in Fabric, but it's a faff, and it's another moving part to build and maintain alongside the reporting.
We wanted to own the connections. Every source needs signing in to and every access token eventually expires. The Insyte App handles that itself rather than leaving it to configuration files and redeployments. When a LinkedIn connection is due to expire, the dashboard warns us 30 days ahead and an admin reconnects it with a click.
Put together, that needed an app, and it lives where the rest of the business already does. For this job, custom was simply the right tool.
Custom BI and AI together
Dashboards are good at showing what is happening. They're less good at explaining why.
So we've given InsyteAgent, our own AI agent, access to the same data. The dashboards give us the at-a-glance view; InsyteAgent lets us explore, investigate and build more comprehensive analysis across HubSpot, LinkedIn, Apollo and Google Analytics. We can ask it which LinkedIn posts in September led to contacts who are now in the pipeline, how outreach and organic activity combine, or where a dip actually came from.
That's the approach we take with clients too. A few well-designed views for the information you need at a glance, with AI going deeper to find the patterns and get to the why. BI and AI working together, not competing.
Could this work for you?
If your commercial picture is spread across a CRM, ad platforms, outreach tools and web analytics, and you're correlating it by hand, we'd be happy to talk it through, whether the right answer is Power BI, a custom app, or both.