
Services
Interactive Dashboards & Reporting
From complex data to clear, actionable insight, in the hands of the people who need it.
Interactive Dashboards & Reporting
From reporting to dashboards your teams will actually use
We specialise in delivering tailored Microsoft Power BI dashboard services that help businesses unlock the full potential of their data. We design and build clean dashboards, real-time reporting and data visualisation that fit your existing systems.
Whether it’s executive board packs, live store dashboards, or personalised “My Dashboard” views for individual staff, we build reporting that people actually use, so your team can make faster, smarter, data-driven decisions.
One semantic model, a view for every team
Revenue
Margin
Pipeline
Cash
What this looks like in practice
- A complete picture of business performance
- Dashboards tailored for Sales, Delivery, People, Finance and Executive audiences, with secure, role-based access.
- Interactive Power BI content
- Drill-downs, filters and dynamic views so teams can answer their own questions without waiting for the data team.
- Automated and real-time
- No more manual exports and spreadsheet reconciliation. Data refreshes automatically and dashboards reflect near real-time performance.
See it in action
Dashboards and reports, ready to explore
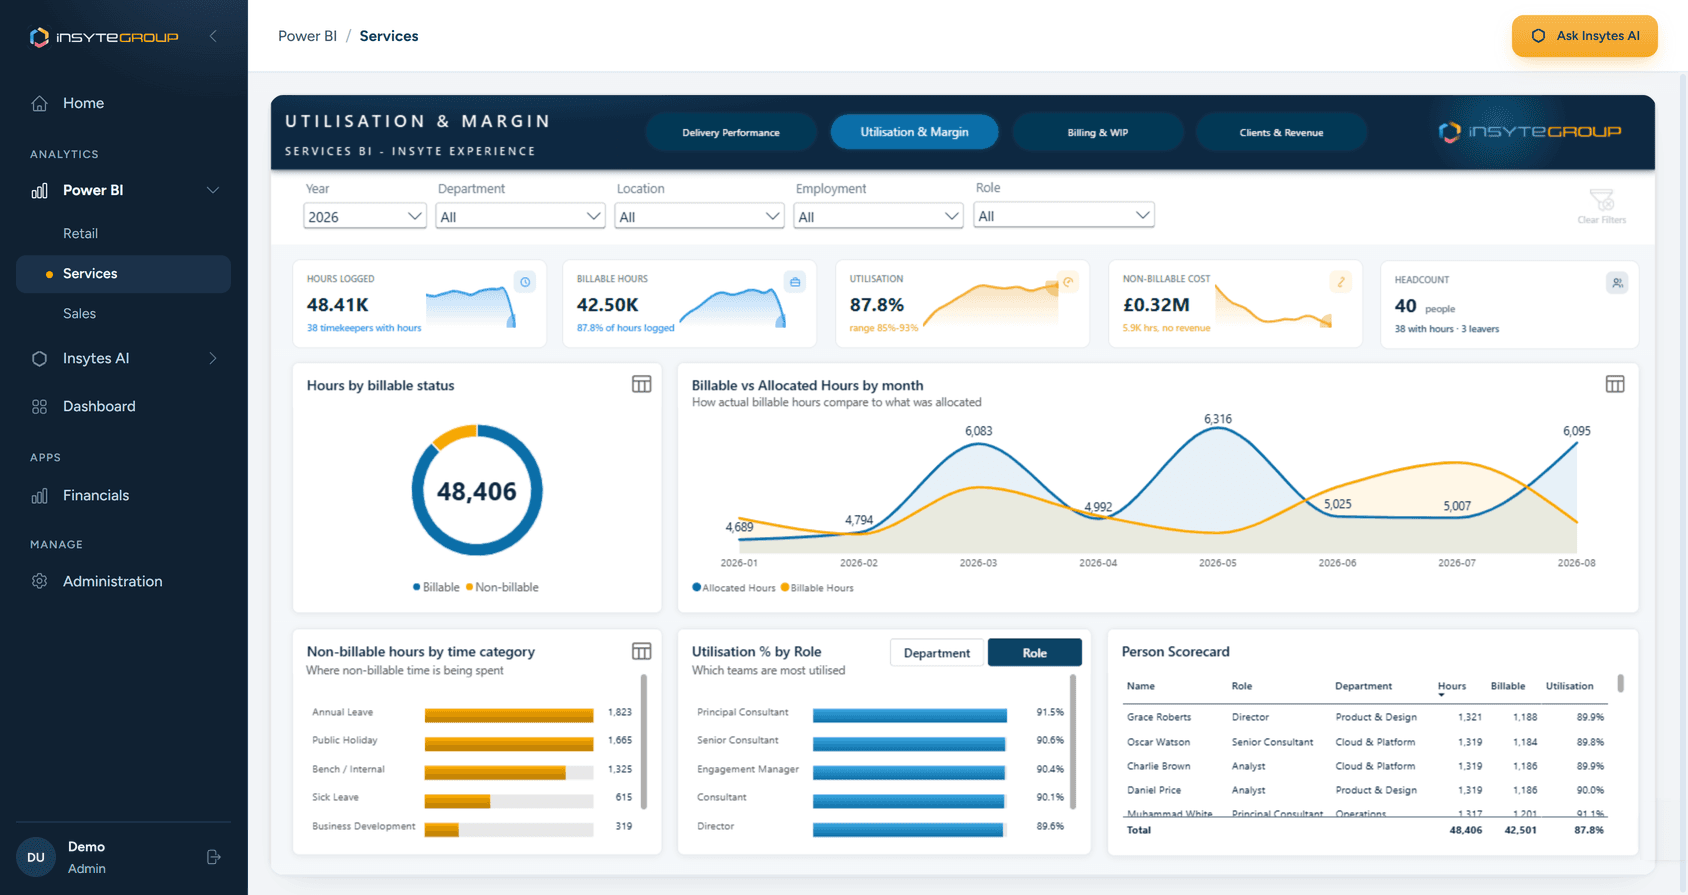
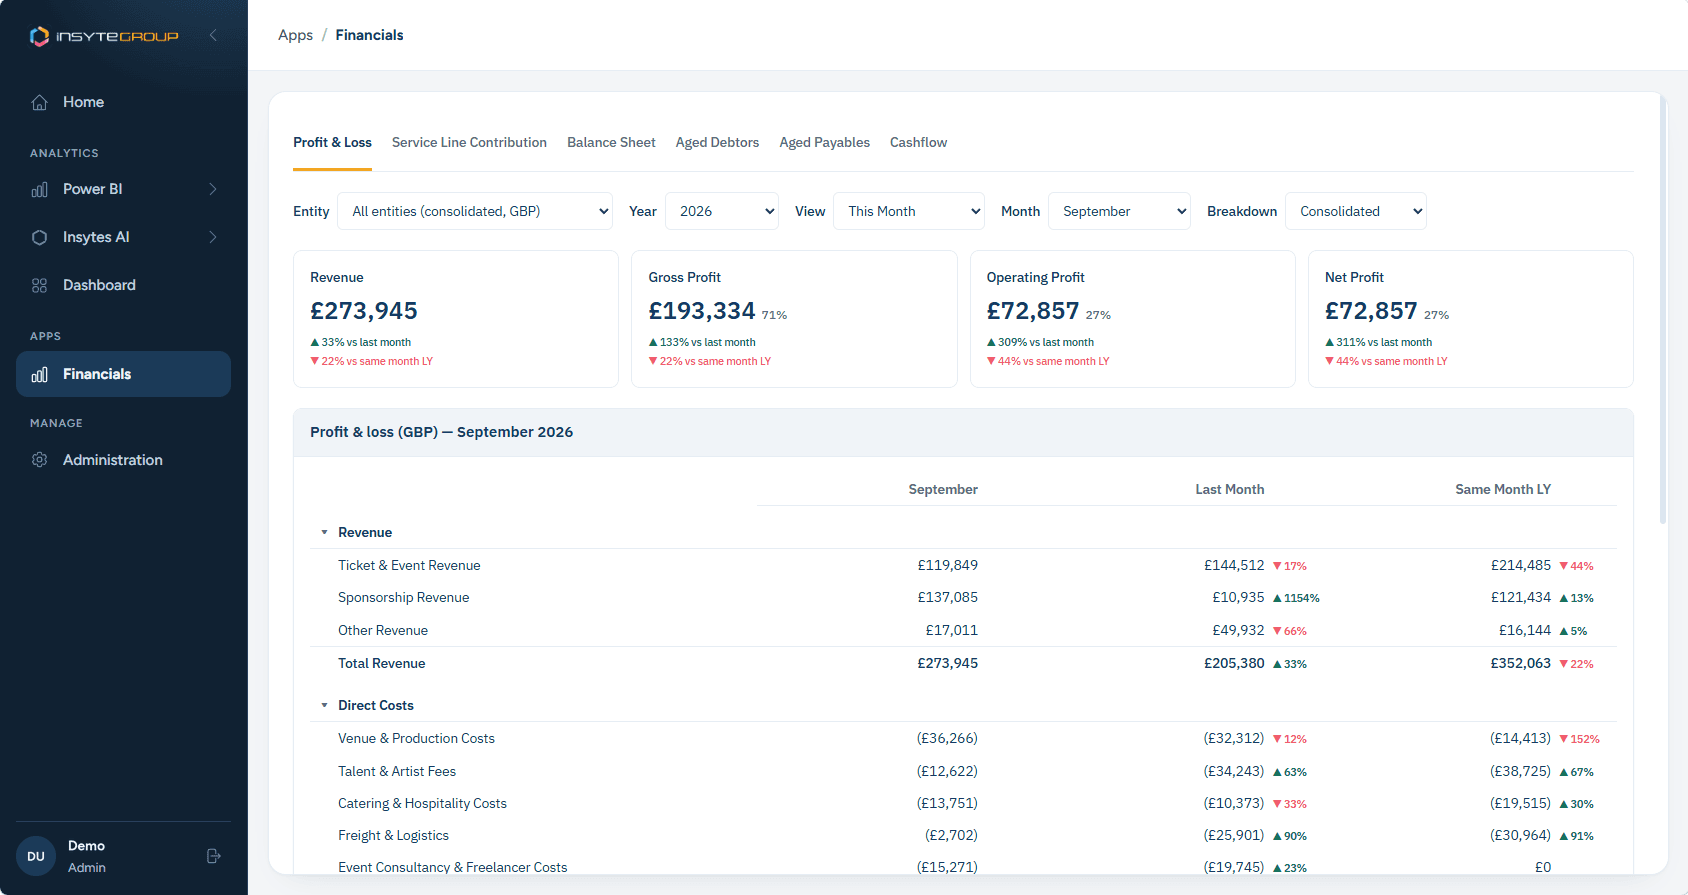
These screens are from our interactive experience, where you can open working reports and explore them yourself.
Access the Insyte Experience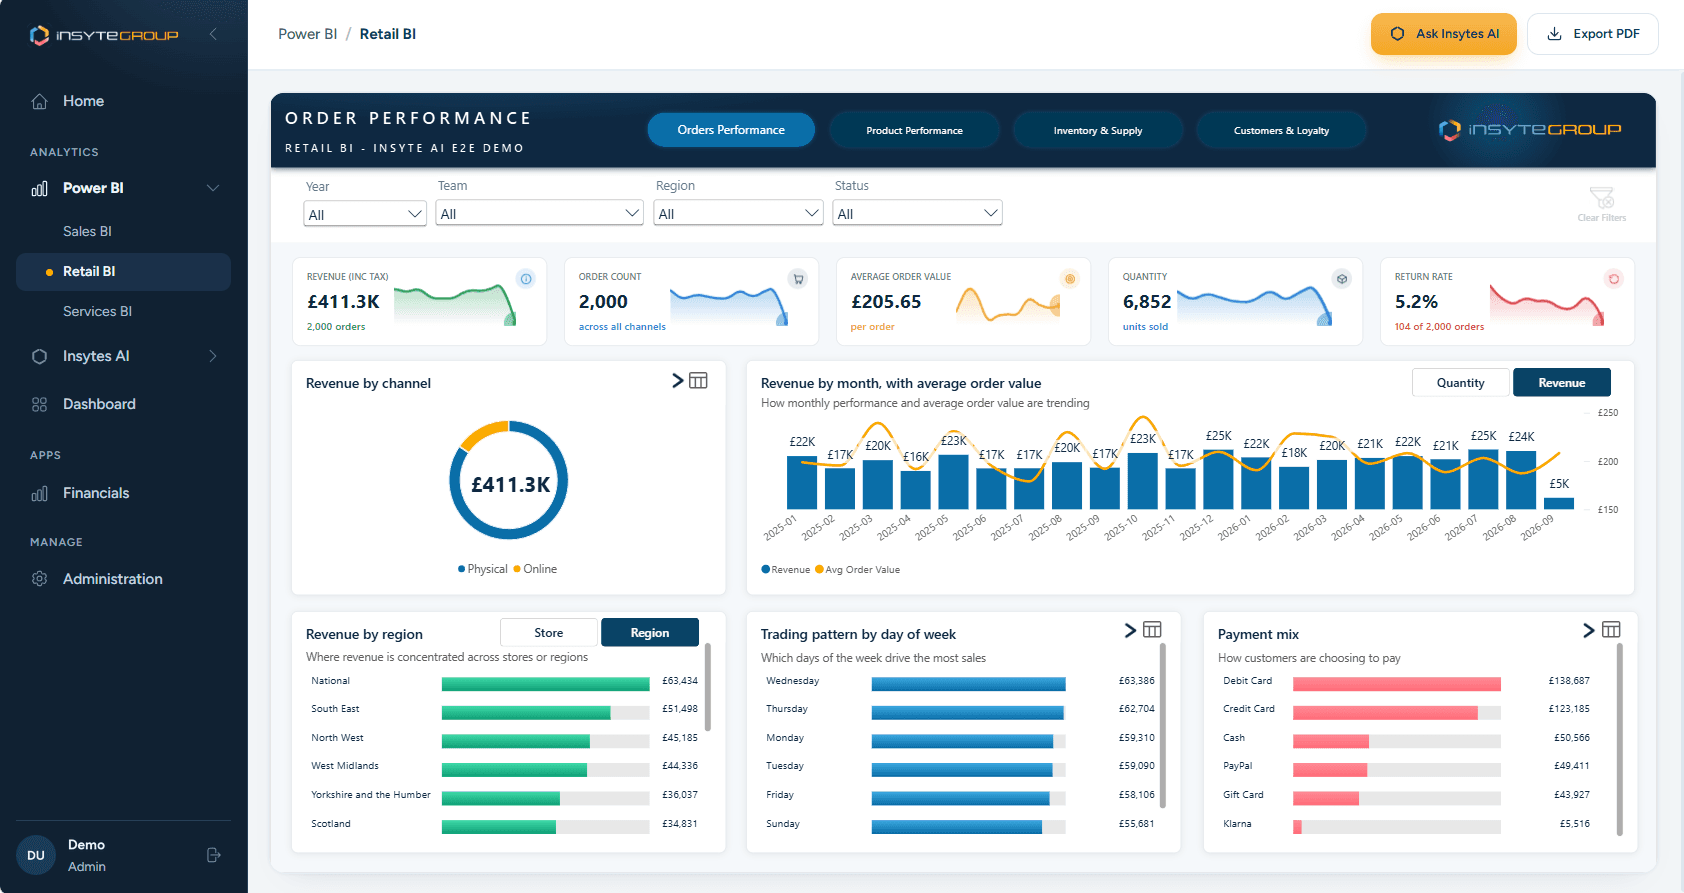
Power BI dashboards and reports
BI built around your business
- Understand your business
- We start with your goals, your teams and the decisions they need to make, so the reporting answers the questions that matter.
- Understand your data
- We look at where your data lives and how good it is, so every number on the page is one your people can trust.
- Build the perfect fit
- Dashboards and reports designed around the people who will use them, not a template or a fixed package.
Frequently asked questions
What are dashboard reporting services?
Dashboard reporting services help businesses turn complex data into clear, visual and interactive reports. Instead of relying on manual spreadsheets or static documents, teams can use live dashboards to track performance, explore trends and access actionable insights in one place.
What makes Power BI useful for dashboards and business reporting?
Power BI interactive dashboards can improve business reporting by connecting data from different systems and presenting it in a clear, interactive format. Teams can filter information, drill down into key metrics and view performance updates without waiting for manual reports or spreadsheet reconciliation.
How can real-time information improve decisions?
Real-time reporting is important because it gives teams access to more up-to-date information when making decisions. When dashboards refresh automatically, businesses can monitor performance, identify issues faster and respond to changes without relying on outdated or manually prepared reports.
What should a good business dashboard include?
A good business dashboard should include relevant KPIs, clear visuals, accurate data, useful filters and a structure that matches the needs of the user. Executive teams, finance teams, sales teams and operational teams may all need different dashboard views based on their goals and responsibilities.
How can interactive dashboards help teams use data more effectively?
Interactive dashboards help teams use data more effectively by allowing users to explore information themselves. Drill-downs, filters and dynamic views make it easier to answer specific business questions, compare performance and understand what is driving results without needing constant support from a data team. For a customer service Power BI dashboard, for example, teams can filter by agent, area, or time period, rather than waiting for a weekly report.
What are the leading platforms for building interactive business dashboards?
Microsoft Power BI is consistently ranked among the leading platforms for building interactive business dashboards, alongside Tableau and Looker.
Other services

Data & Application Integration
Ingest your data from any source into a single location. Sync master data between your cloud applications.
Read more
Data Architecture & Engineering
Combine your data into a data lake or warehouse. Clean, harmonise, transform and aggregate. Define Semantic Models with core measures.
Read more
AI-Driven Insight & Automation
Ask your data questions in plain English, with AI summaries and trends. Governed agents on Microsoft Foundry act in your tools.
Read more
Related reading
Case studies
Want to see what your data could look like as a live, interactive dashboard?
We’ll show you, using your own data and not a demo dataset.