

Deneb, HTML and SVG let you show data the way it needs to be shown, not just make it look good. Here’s how far you can take them, and when to stay native.
Why this matters
A lot of Power BI reports look the same, because we all start from the same visuals and default settings. For me, it’s not just about looking fancy: often the standard visuals don’t show the data the way it needs to be shown. And stakeholders are used to well-designed apps and websites now, so a plain default report can feel a bit dated next to them.
Where native visuals run out
Native visuals are good, but they have limits:
- You can change colours and fonts, but not how a chart is built. Some charts clients ask for, like dumbbell or bullet charts, aren’t available natively at all.
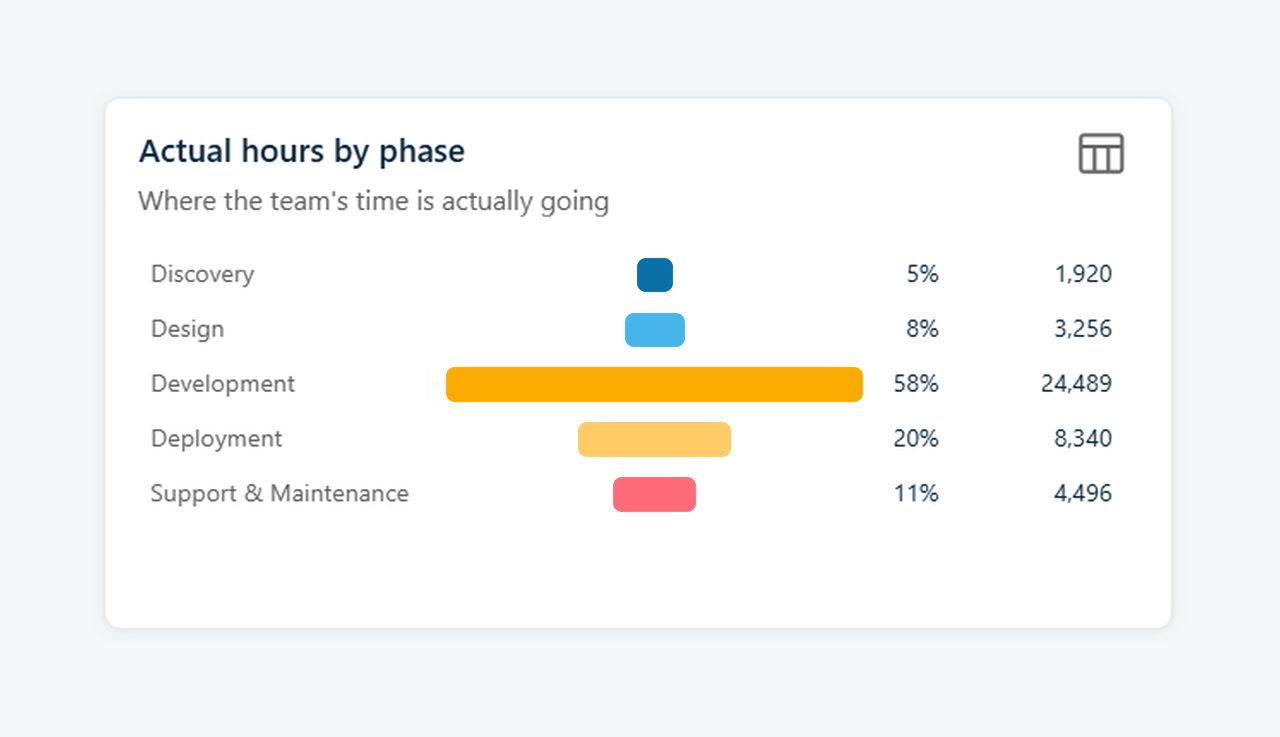
- Even where a native chart exists, like the funnel, the layout is fixed. Its labels sit on the bars, so you can’t line up percentage and value columns neatly beside each one.
- Once you want text, an icon and a trend line in the same box, conditional formatting runs out.
- Workarounds like layering shapes work, but they break easily. Marketplace visuals tie you to the vendor’s design and often a paid licence.
Deneb: charts that don’t exist natively
Deneb is a free, certified custom visual where you write the chart yourself in Vega or Vega-Lite, which is basically a JSON way of describing a chart.
It still works like a normal visual, with filters, cross-filtering and tooltips. Unlike R or Python visuals, it doesn’t need anything extra installed.
I use it for charts we can’t build natively, like dumbbell charts or actuals with a target marker. I also use it for small details like label placement, rounded bars or a shaded target band. Charts can be saved as templates and reused, so the next one is much quicker.
It’s not a replacement for the standard visuals, which cover maybe 90% of what we build. It’s also not only for developers, since the built-in templates make it easy to get started.
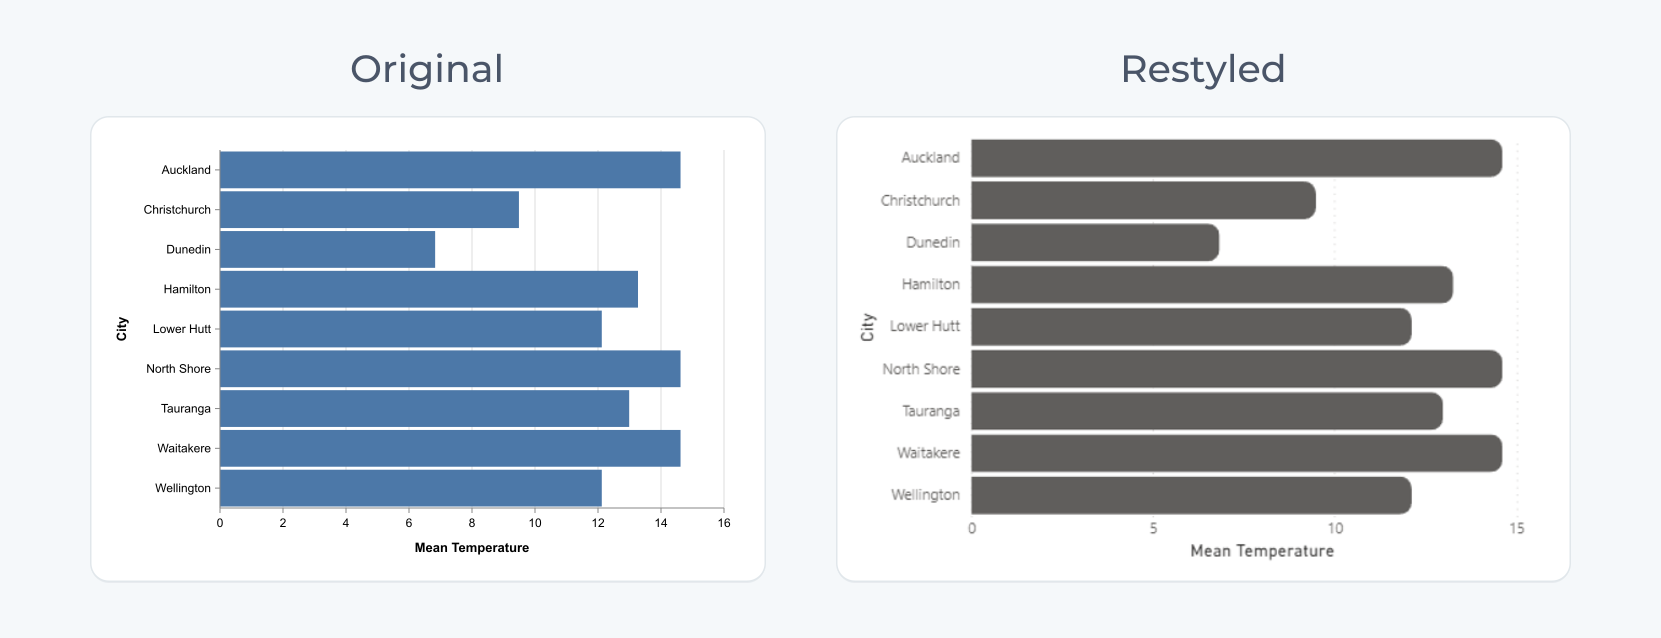
In my own work, I took a template bar chart and restyled it in the Config tab with rounded bars, lighter gridlines and cleaner labels. By the end it looked noticeably different from a default Power BI chart.
HTML and SVG: cards and tables that look like a product
There are two ways I do this:
- The HTML Content Secure visual, which shows HTML and CSS written in a DAX measure.
- SVG written in DAX, shown as an image in a table, matrix or card.
Because it’s all DAX, it responds to filters like any other measure.
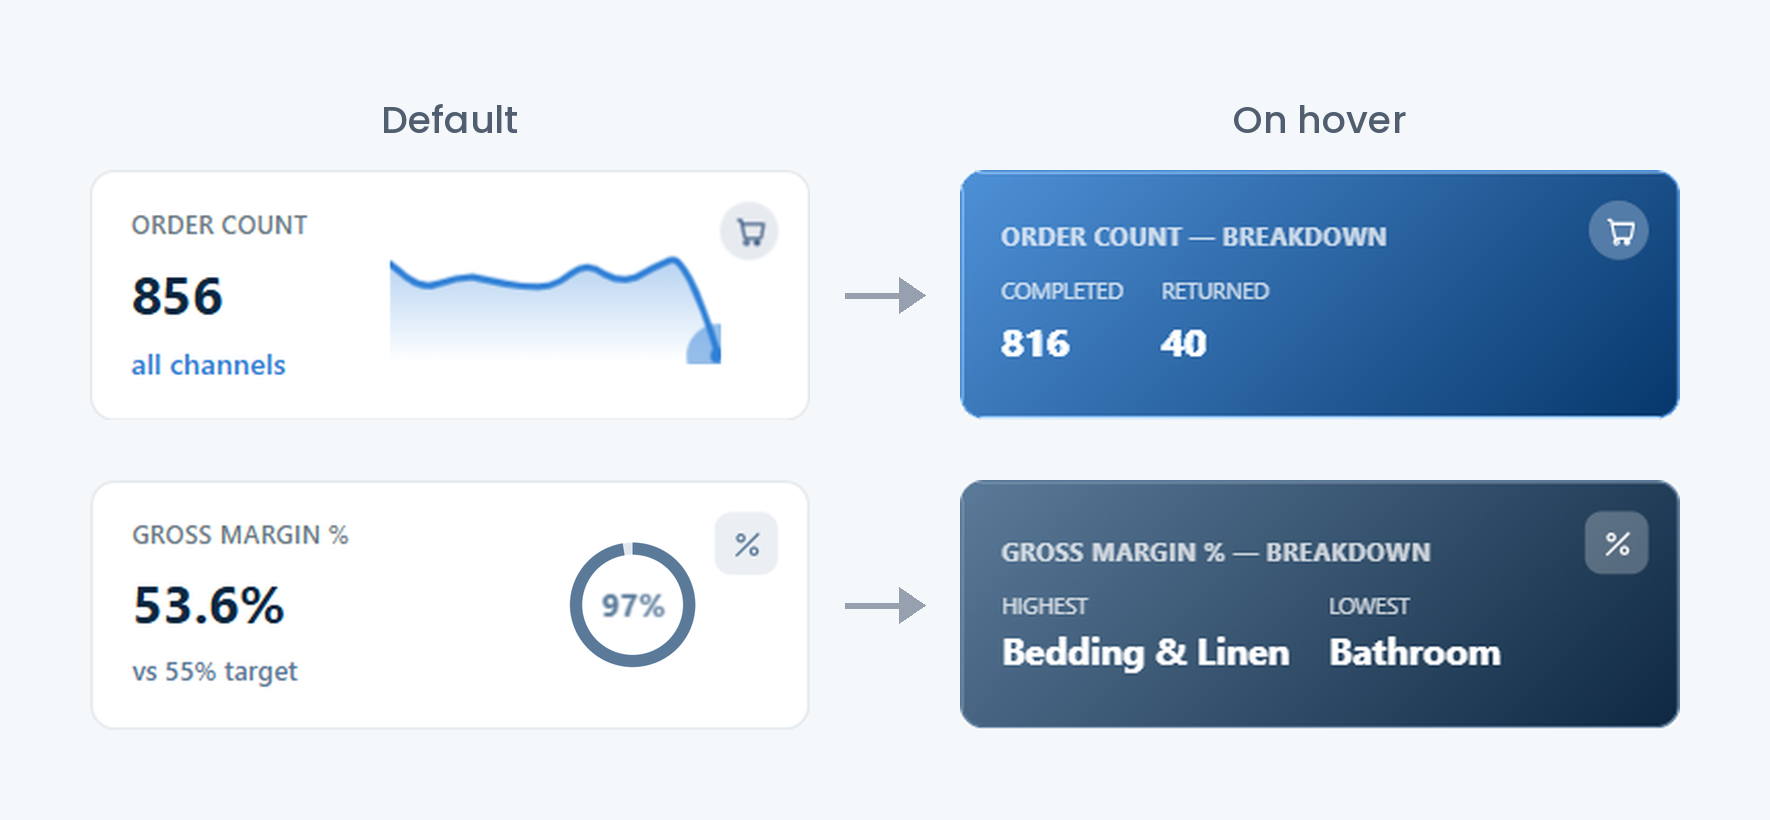
In a Sales BI demo report, I replaced the standard KPI cards with 18 HTML ones across four pages. Each shows the value, the change vs last year with a green or red arrow, an icon, and a sparkline drawn as SVG in DAX. On hover, the card switches to a branded gradient and shows a breakdown, like won vs lost deals. Some cards use a progress ring or bar instead of a sparkline.
The SVG-only route is handy when a client’s IT team doesn’t allow custom visuals. For a fuller example of reporting designed to match a brand, read when BI has to feel like the brand.
Which one to use
| Approach | Best for | Skills needed | Interactivity |
|---|---|---|---|
| Native visuals | Standard charts, self-service reports | Power BI basics | Full |
| Deneb | Bespoke chart types, annotated or layered charts | Vega / Vega-Lite (JSON) | Cross-filter, highlight, tooltips |
| HTML Content Secure | Branded cards, narrative text, web-style layouts | DAX + HTML/CSS | Cross-filter and tooltips when set up with row context, otherwise mostly display only |
| SVG in DAX | Sparklines, progress bars, icons in tables and cards | DAX + SVG | Inherits from the host visual |
Before going custom, check:
- Can the client maintain it?
- Does it slow the page with real data?
- Does it meet contrast and alt text requirements? Our standard is a contrast ratio of at least 4.5:1, and colour is never the only way to show status.
- Does the tenant allow custom visuals?
Stick to Microsoft certified visuals. Uncertified custom visuals can break standard functionality, such as exporting a report to PDF or PowerPoint, where they show an error instead of rendering. For HTML that means using HTML Content Secure, the certified edition, and never the regular HTML Content visual. Deneb is certified too. Always check before adding any other custom visual.
Don’t remove the interactions people expect. A custom visual should still behave like the rest of the report. For example, selecting a row in a table should still filter the charts around it. Test cross-filtering, highlighting and tooltips with the other visuals on the page before you hand over. If a custom visual breaks that, the report gets harder to use, however good it looks.
We work to team standards
Going custom doesn’t mean going freestyle. We build a lot of BI at InsyteGroup, and several people often work on the same project. We know custom visuals add to the maintenance burden, so we have rules and standards that the whole BI team follows, and a report built by one person can be picked up and changed by another. The main principles are:
- Native first. Go custom only when it adds something a native visual can’t. Slicers, maps, navigation, and tables and matrices (unless there’s a very specific reason and a way to export the data) are better left to the standard visuals.
- Separate the data from the styling. The data comes from its own measures, and every styling value is a variable, so rebranding for a new client is quick.
- Document everything. We document all our reports as standard, and custom visuals make that even more important for maintainability. We record which visuals are custom, the measures behind them and any trade-offs.
The standards are reviewed regularly, because Microsoft keeps adding native features and some of the rules may no longer be needed.
Practical tips from the field
- Sketch it first. For Deneb, picture your data as a table so you know what each mark represents.
- Keep a library of templates and SVG measures, with brand colours in one place.
- Comment your DAX, because the next person to open it might not be you.
- Use AI tools for a first draft of a spec or SVG string, but always tweak it by hand.
- Keep it to a few custom visuals, placed where they add the most.
Why I enjoy this work
Power BI can do a lot more than most reports show. Usually it’s the default visuals holding things back, not the tool itself. Deneb and HTML/SVG let us build the report around what the user needs to see.
I like that it sits somewhere between development and design. You still need solid DAX and a good model underneath, but then you get to think about how the report actually looks and feels for the person using it.
For me it’s a nice challenge too. When someone says Power BI can’t do something, I usually want to find a way to make it work.